


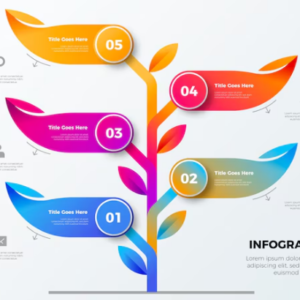
“Dive into the realm of captivating data representation with our stunning colourful gradient infographic, ingeniously crafted to emulate the graceful form and vibrant hues of a blooming flower. Drawing inspiration from nature’s aesthetic allure, this infographic transforms raw data into a mesmerizing visual narrative, where each gradient layer serves as a metaphorical petal, delicately unfolding to reveal valuable insights.
Envision a spectrum of colors seamlessly blending and transitioning, akin to the seamless growth and transformation observed in nature. Each hue symbolizes a distinct data category, meticulously chosen to evoke emotions and facilitate comprehension. From the warm embrace of sunrise oranges to the cool tranquility of twilight blues, the gradient palette captures the essence of diverse datasets, inviting viewers on a sensory journey through information.
Much like the intricate patterns found in the intricate anatomy of a flower, the infographic’s design intricacies are purposeful and deliberate. Curves and contours mimic the organic flow of petals, guiding the audience’s gaze through the narrative with fluidity and grace. Amidst this visual symphony, data points emerge as focal points, strategically positioned to emphasize key findings and foster deeper understanding.
Beyond its aesthetic allure, this infographic serves a practical purpose, enabling data-driven decision-making with clarity and precision. By transcending traditional charts and graphs, it empowers audiences to engage with information on a more intuitive level, fostering meaningful connections and sparking insights that transcend mere numbers.
In essence, our colourful gradient infographic stands as a testament to the marriage of art and analytics, where the beauty of nature converges with the power of data visualization to inspire, inform, and captivate. Through its evocative imagery and insightful storytelling, it cultivates a deeper appreciation for the interplay between creativity and information, inviting viewers to embrace the transformative potential of visual communication.”
Reviews
There are no reviews yet.